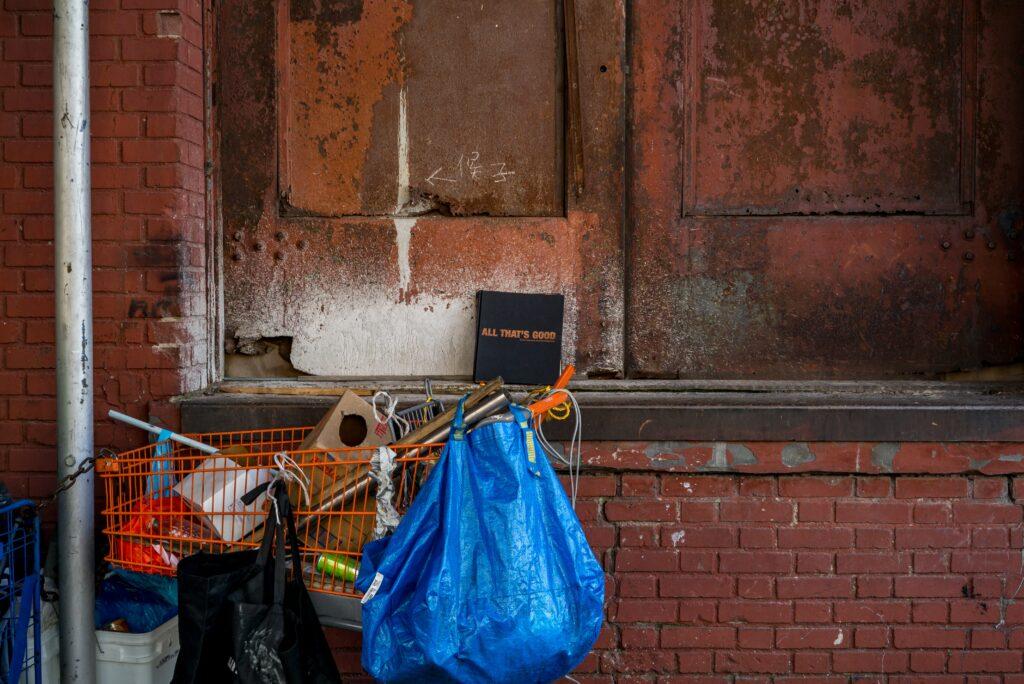
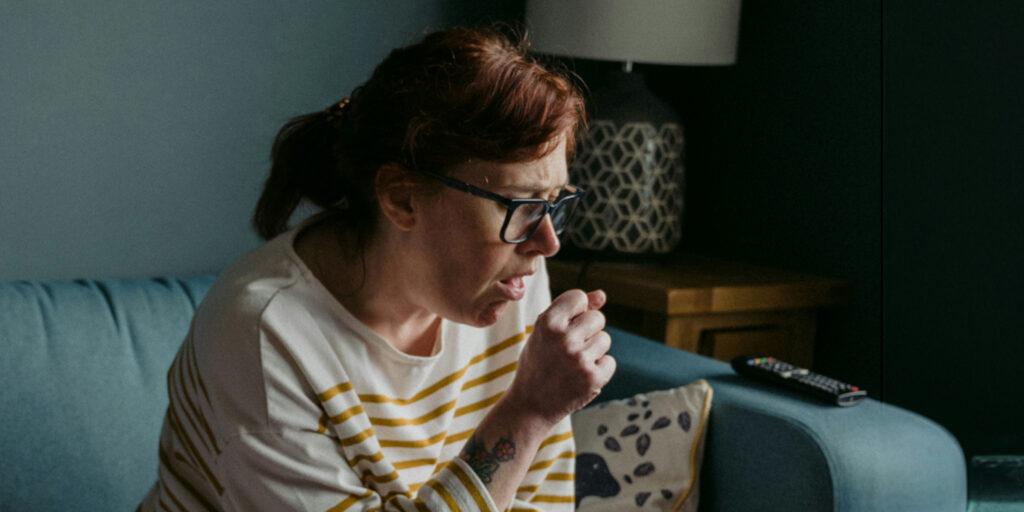
Let’s begin with the basics, food and money.
In the past 12 months, a Foodbank survey shows, 3.7 million Australians were too hard up to eat properly. 1.7 million children went hungry, one out of six adults didn’t have enough to eat, 21 percent of Australians were severely food insecure and 77 percent of households couldn’t cope with the cost of living caused by the cost of food (up from 64 per cent in 2022), and 306,000 households are given food relief every day. More than 13 per cent living below the poverty line. Foodbank says some households go days without eating.
That’s all pretty strange, isn’t it?
Australia is one of the richest countries in the world– or so we are led to believe. Seventh in the world for food affordability, tenth for availability. We produce more food than we consume. Plenty of food to go around, isn’t there, so what’s the problem?
Well, whether it is due to seasonal shortages or the lack of skilled workers in food
production, or the supermarket ripping off the customer, the problem is the cost of food.
Here are some examples over the past 12 months. As of August, food prices were up an
average of 7.5 per cent over the past year. Dairy products up 15.2 per cent; bread and
cereals, 11.2 percent; meat and seafood, up 3.5 percent. Half a kilogram of cheese, $6.60
last year, $7.70 this year, or more depending on the type of cheese and where you shop.
Vegie prices swinging all over the place but up to 40 per cent more. It you want a cheap
meal out, prices at McDonald’s compared to 2019 are up anywhere between 30 to more
than 50 per cent for almost everything.
Okay, so prices have gone up, but surely wages have kept up?
Actually, no. In 2022 real wages declined by 4.5 per cent, the biggest slide on record. This
flattened out towards the middle of 2023 but the level remains low. Even the middle class is
feeling the pinch and it’s not just food. Surveys show that 24 percent of those surveyed
don’t have enough money for an emergency; 20 per cent not enough to buy food and pay a
bill; and seven percent unable to pay a mortgage. Rising living costs undercut the value even
of what used to be regarded as high salaries ($100,000 – $120,000).
The bank statistics back up these figures. The level of savings is falling and there’s been a
record decline in household disposable income, down 5.1 percent from 2022. Real wages
are below 2019 levels.
By September, the ANZ bank was recording more than a 30 percent increase in late
repayment of loans over last year, the overdue amount totalling $13 billion. There was a 92 percent increase in the size of 60-89 day loan arrears, with many borrowers about to
default.
In Melbourne, some councils are recording a rise of arrears in rate payments of more than
80 percent in the past three years. In November, the NAB reported a 44 per cent rise in the
number of people experiencing financial hardship over the past three months because of
rising interest rates and the cost of food, petrol, gas and electricity. Household income to
savings are now the lowest since 2008.
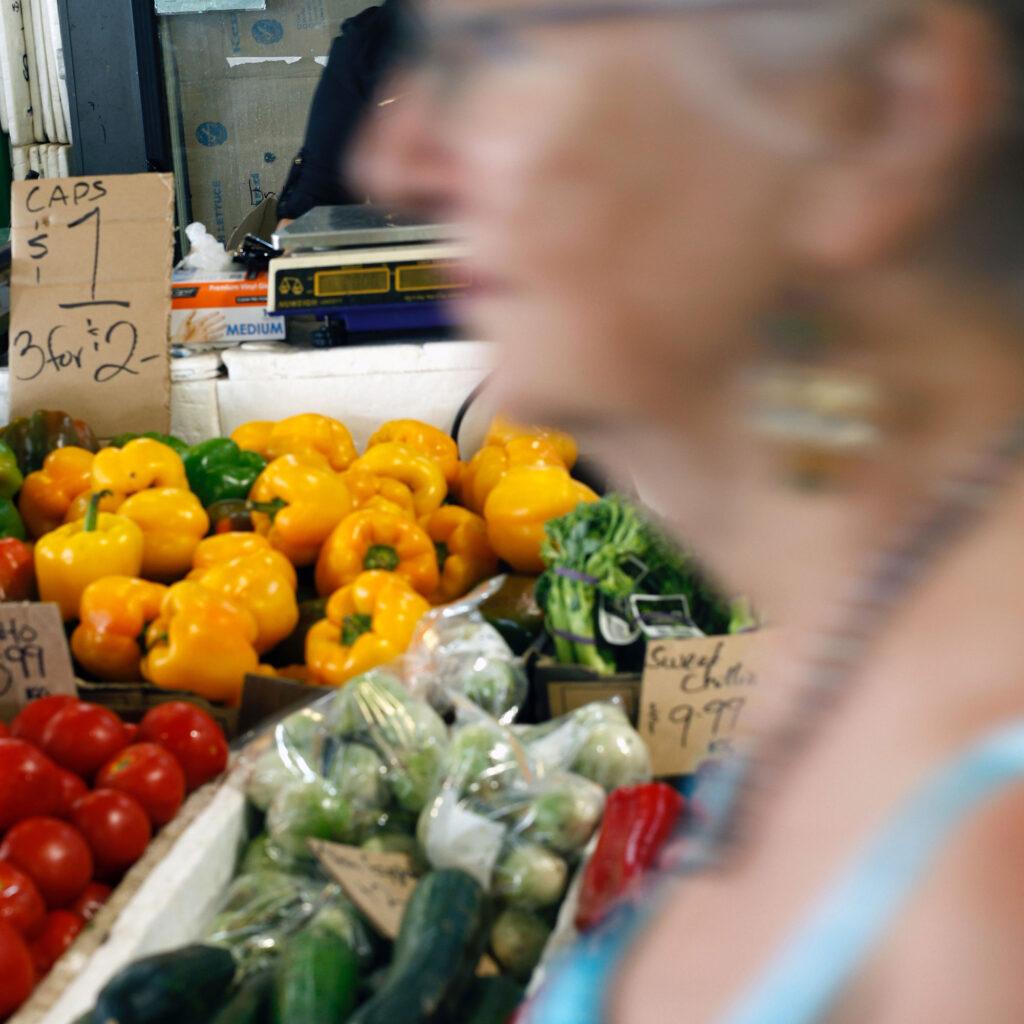
living in poverty. (Image: David Clode)
But most people are doing okay, aren’t they?
No, because everyone has to buy food, pay rent or pay off mortgage and pay for the utilities
at the same time. It’s all relative to how much you take home every week and to some
extent, your age. Some older people are well padded with investments, superannuation and
real estate but a lot aren’t.
National Seniors Australia reports that 40 percent of single age pensioners who rent are
living in poverty while OECD statistics show that old age income poverty among Australians
aged 66 and over is running at 23.7 percent compared to the OECD average of 14.1 percent.
Only 0.7 percent of agent pensioners get the maximum rate, the entitlements of the rest
having been whittled down by means-testing and you now have to wait longer for the
pension anyway, the age threshold having been raised from the 65 of years ago to 66.6 in
2021, and to 67 in July this year (for people born after January 1957 and to be pushed
upwards to 70 in 2035, by which time a number of people eligible would have died, saving
the government money). It seems to be steadily moving towards the abolition of the old age
pension altogether.
Commenting on the Australia’s age pension scheme in 2020, the OECD said the aim was to
provide seniors “with an income adequate enough to ensure a basic living standard.”
Depending on your definition of ‘basic,’ and whether you own your own house or rent, the
Australian pension for some does not even meet basic standards.
Figures show that to cover the basic annual cost of living you need to be taking home $44-
48,000 a year. Compare this to the take-home rate for a single aged pensioner, $1002 a
fortnight or $1096 with benefits. The maximum rate for couples is $39, 260, well below the
basic annual cost of living. For a single pensioner who has to rent, $2000 a month comes
nowhere near living costs and would scarcely be enough to rent a small apartment in an
unfashionable suburb.
Compare these amounts to basic federal parliamentary pensions, well over $100,000 or the
life pension for Daniel Andrews, $300,000 a year, or for Anthony Albanese when he retires,
$400,000.
If some of the old are doing it hard, so are some of the young. Buying a house is beyond the
reach of many but the 25-34 age group bracket still constitutes the greatest number of
home loan mortgagees. However, Reserve Bank interest rate rises over the past year have pushed mortgage repayments up to a level some can’t meet, taking into account other living cost increases.
While the over 55s with money are spending it, many people in the 25-29 age group are
cutting back. A Monash University survey shows that of those in the 18-24 age cohort, one
in five is experiencing food insecurity, partly caused by the shortage and high cost of rental
accommodation.
Again, none of this seems to square with Australia’s reputation as a wealthy country, so the
next question is “Who is it wealthy for?” Well, the four big banks, of course, making big
profits (about $30 billion a year) while customers struggle to pay off their mortages, loans
for cars and so on. The Statista web site show that Australia has one of the highest average
wealth levels in the world: $US685, 226 for Switzerland, $551,347 for the US and $496,719
for Australia.
What it does not show except for broad estimates is wealth distribution. In the US for the
second quarter of 2023, the top 10 earners owned 69 percent of the wealth, while the
lowest 50 percent owned 2.5 percent. The top one percent owned 21 percent of the wealth,
according to estimates. The income disparity between the CEO and the worker has moved
from 20.4 times the worker’s wage in 1965 to 365.6 times in 2020. In Australia the top ten
earners owned 33 percent of the national wealth and the top one per cent about 10
percent.
Overall, by the end of November 2023, a shortage of housing, a slow easing of inflation,
despite rising food and rent costs, a slow decline in GDP, poor labor growth and a small
increase in unemployment (from 3.66 per cent to 3.77 percent in late 2023) were dominant
characteristics in the economy.
Other indicators of where the country currently stands include a steady decline in the value
of the $A against the $US/Euro, decreased investment, company collapses in the building
sector in the past year, the bankruptcy of many small business owners and the shrinkage of
the manufacturing sector, partly a long-term consequence of deregulation of the economy
four decades ago and the flight of industry to south-eastern Asian countries with protected
industrial zones and low wages.
Despite the tight housing and employment market, and predictions by economists of a
recession coming in the next two years, the government has been rapidly expanding
immigration, despite the consistent evidence of surveys showing that Australians do not
want a bigger population. 1.5 million arrivals are planned for the next five years.
Currently the greatest national number of immigrants come from India, followed by China;
by the end of June 2021, Australia had an Indian-born population of 710,380 compared to
337,420 in June 2011, an increase of 57 per cent. The government seems to have a
preference for Indian immigrants but why is not explained. Perhaps they’re just better
qualified than other visa applicants.
Increased life expectancy, rising from 68.97 in 1950 to 83.94 in 2023, and the relatively low
birth rate of Australian women, whose average 1.69 number of children in 2023 falls below
the 2.1. population replacement level, plus a shortage of skilled labor in some sectors,
largely dictate government immigration policy.
Current planning would bring the current population of 26.5 million to 30 million by 2032/3,
35.9 million by 2050 and up to 45 million by 2071. More people will mean more competition for jobs and housing, already in short enough supply to meet current needs and more demand on the already stressed social service sector. Employers will benefit as recently arrived migrants tend to work longer hours for 13 percent less money, according to 2019/20 figures (their annual average income $45,351 compared to $52,338 for the settled population). The increased pool of labor will increase competition for jobs and maintain a static or downward pressure on wage levels.
Statistics are one thing and how people actually live quite another. Even the Treasurer, Jim
Chalmers, expects a “bumpy” road ahead, as he put it, given a slowdown in the Chinese
economy and “global economic uncertainty.” Chalmers is on the Labor right and sees
economic development through the prism of public-private collaboration and the use of
technology, regarding a ‘robot tax’ as feasible to support human workers replaced by a
machine.
Whatever the figures show, a lot of Australians are doing it very hard, as the deliberate
result of government policies, including putting pressure on the labor market through a
surge in immigration. Without immigration and spending on infrastructure, growth in 2023
would be going backward.
Some escape by moving interstate or overseas in the hope of finding greener grass
somewhere else. The reasons are not necessarily just economic. The pandemic flushed into
the open an ugly, authoritarian streak in Australian culture that has always been there
beneath the surface larrikinism and didn’t go away with the pandemic but rather has been
consolidated by it.
Australians are now surveilled as never before, with a wide range of tools available to the
government to control the public and stifle dissent, including AI, ‘misinformation’ and digital
legislation and cyber security control. One way or another, the ‘lucky country’ is far from
what it used to be.
